Benin DXpedition March 2006 : Propagation
Propagation forecast for 80m-10m from Benin (TY)
Predictions for specific areas
 The following propagation predictions are made with the
WinCAP Wizard
software.
In this chart we provide propagation predictions for specific areas: I2 (Milan), PA (Amsterdam), GM (Glasgow), W2 (New York), W0 (Kansas City), W6 (Los Angeles), JA (Tokyo), VK (Canberra). And this chart is for USA only.
Coverage Maps
This work was done with Ham CAP 1.4 (the HF propagation prediction tool
by Alex VE3NEA).
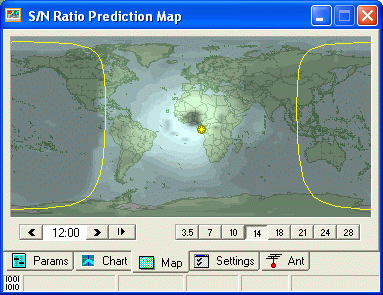
In the chart below, the lighter colored areas represent good relative
propagation.
You can click a band and UTC time and get a look at how propagation
is expected to be.

| 3.5 | ||||||||||||||||||||||||
| 7 | ||||||||||||||||||||||||
| 10 | ||||||||||||||||||||||||
| 14 | 12 | |||||||||||||||||||||||
| 18 | ||||||||||||||||||||||||
| 21 | ||||||||||||||||||||||||
| 24 | ||||||||||||||||||||||||
| 28 |